Digging deeper into the Challenges and realities revealed in the 2023 Feesable School Fee Insights report
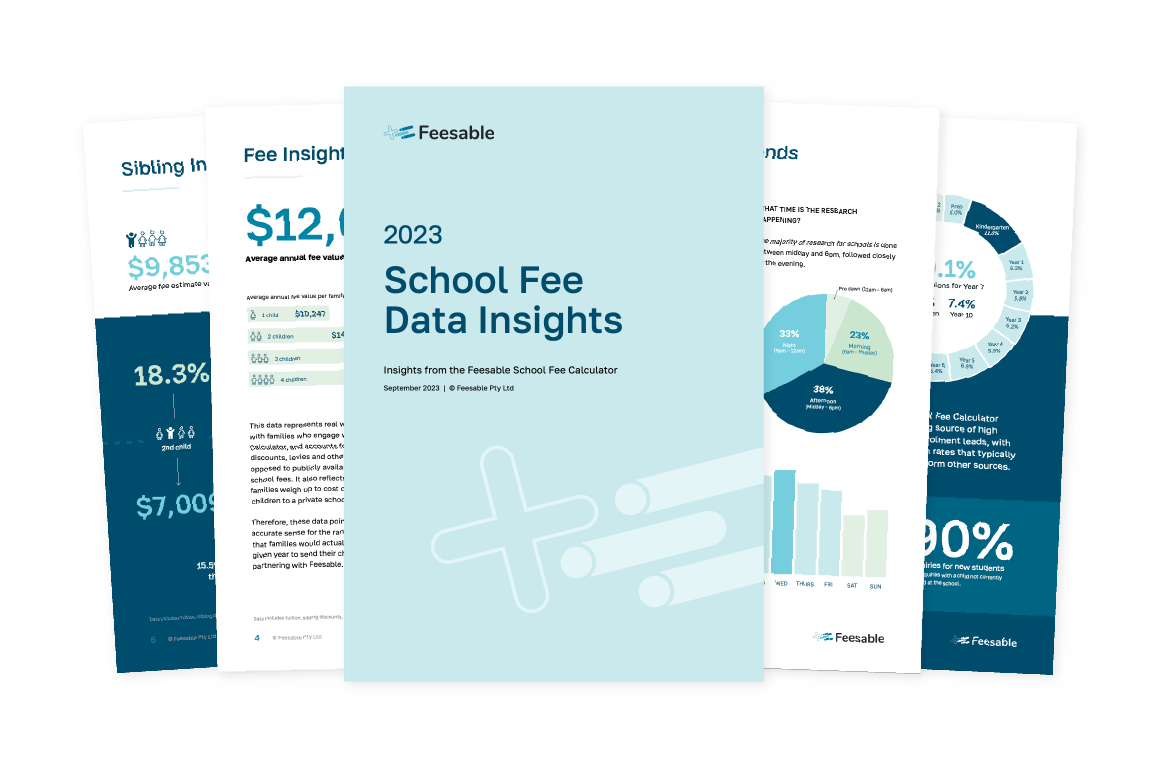
This report has been put together as a useful reference tool for school business, marketing and admissions teams. Drawing from unique data generated by the thousands of families using the Feesable School Fee Calculator last financial year, the report shows insights that are helpful for understanding the market, benchmarking, shaping your fee strategy and planning marketing campaigns.
Real World Data
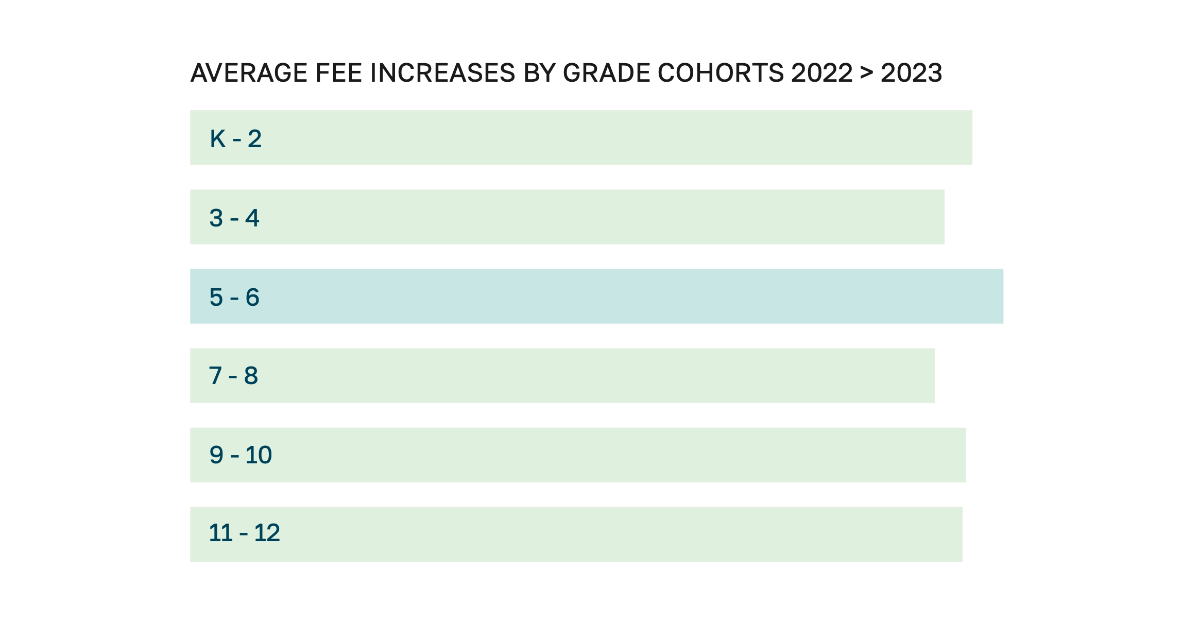
Our data also reveals some interesting trends and figures across year groups, from year group fee averages to year-on-year increases per year cohort – download the report to get the full insights.
The annual challenge of setting school fees
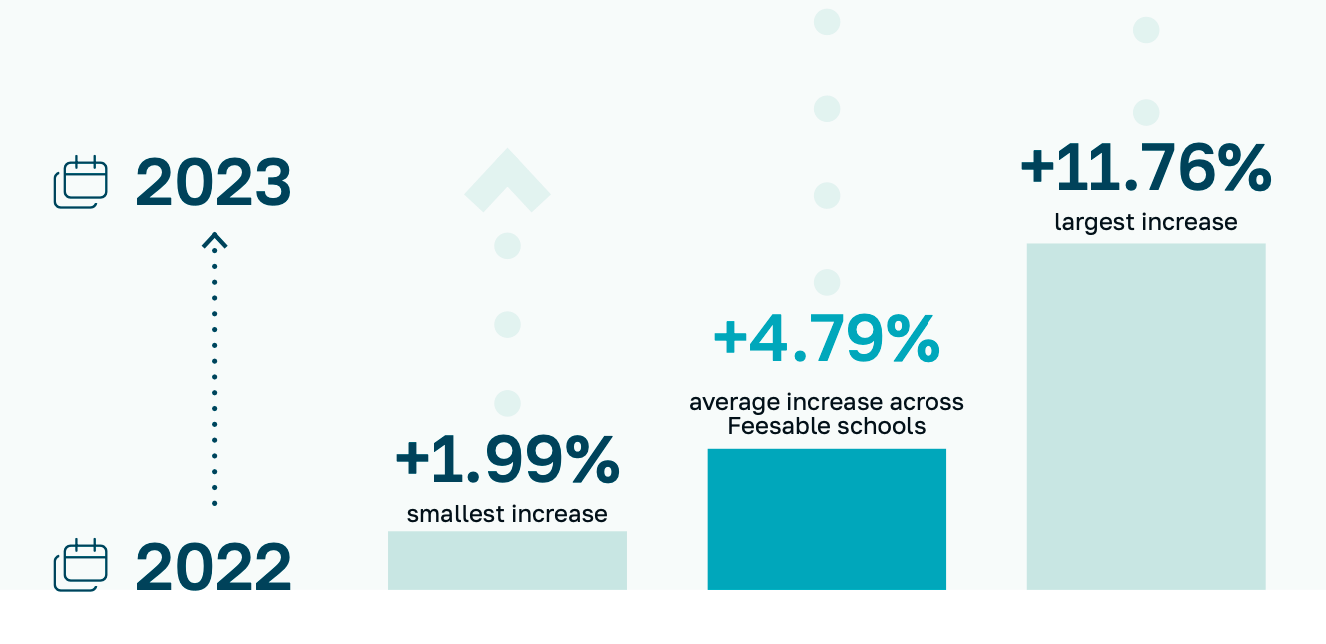
In terms of year-on-year increases, 2023 saw most schools return to standard fee increases. From the data, the average year-on-year increase across Feesable schools was 4.79%. Some schools passed on much larger increases in an effort to re-adjust from COVID years, where fees were kept low to support families and retain enrolments.
A number of schools made little change to top-line tuition, but adjusted sibling discounts to somewhat ‘mask’ increases since this is far less obvious to families. Other schools strategically increased certain year groups and left others static based on demand and supply. Levis and charges are an obvious candidate for increases, and most schools fine-tuned these levies in an upward direction to meet their financial objectives.
Complexity & Transparency
It is no doubt complex for a school to work out and manage their fees, but families also encounter complexity on a number of levels as they navigate school fees. The traditional ‘Fee Schedule’, displayed as a PDF on the website, is the typical way schools communicate their fees – this leaves families to do the often complex work of calculating fees, with all the discounts, levies and charges.
Communicating fees, let alone fee increases, is challenging for schools. Some schools will send out the new year fee schedule to families to inform of the changes, while other schools do little to communicate any fee changes and simply start charging the new fees, much to the surprise of current families – not a great way to engender trust.
These complexities can be addressed through transparency.
The Impact of Discounts
A vast majority of schools offer some form of discount to families. This commonly takes the form of sibling discounts, and early payment discounts. Other less common discounts include staff discount, church affiliation or government schemes to reduce fees.
These discounts benefit both families and schools, but which way the scales tip is difficult to say, and of course varies across schools. For some families, the sibling discount is the difference between attending the private school or not. While early payment discounts often give minimal benefit to families, yet have a big impact on cash flow for schools.
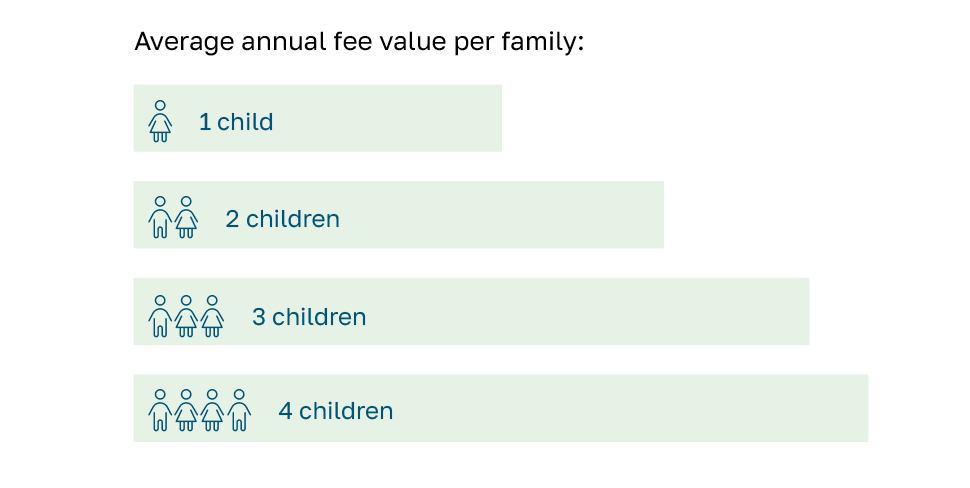
Typically schools offer a sibling discount up to the 4th child, while 15.5% of schools offer a 5th child discount. The spread of these discounts, and how these discounts apply varies greatly – from a simple ‘family’ discount, to complex sliding scales of discounts across year groups and number of siblings.
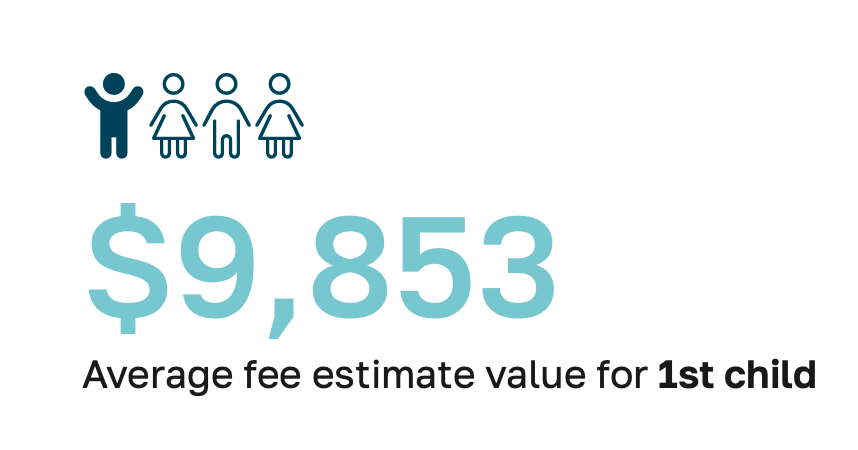
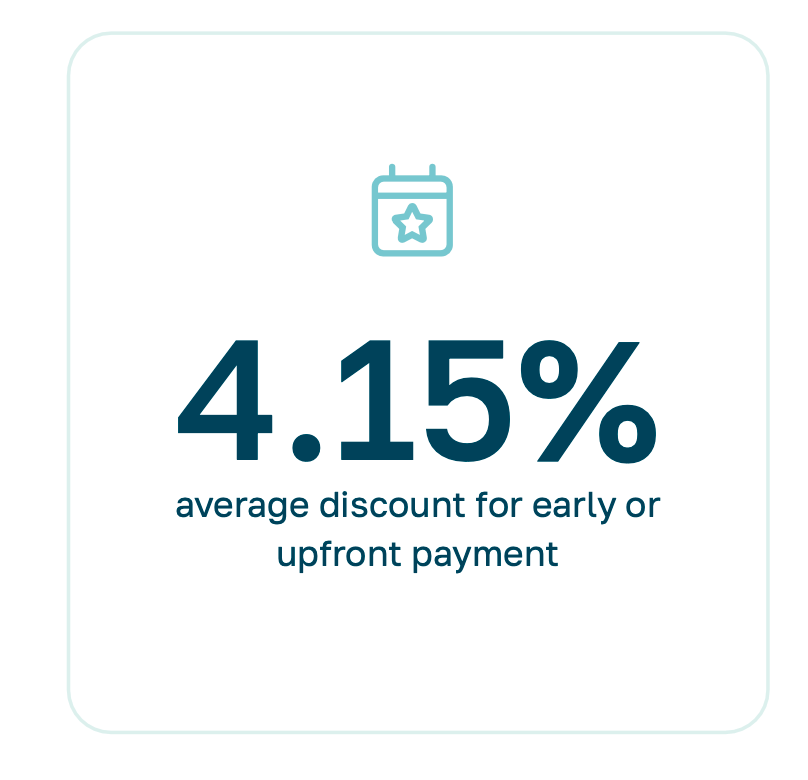
Early payment discounts are one way schools seek to attract families and strategically improve cash flow for the school. A majority of schools offer this type of discount, with an average discount being 4.15% for early payment. The nature of ‘early’ varies from prepayment for a full year before the year starts, through to discounts given for families being on a certain payment plan, per term or per month, with sliding discounts.
Discounts are one of the many components that make school fees complex for families to work out. For the most part, these discounts are of benefit to families in choosing a school, and choosing to remain at the school despite fee increases. So it should be in the interest of schools to make it simple for families to work out these discounts – that’s where smart tools like the Feesable School Fee Calculator will be of great use to families, and hence a benefit to schools.
Demand & Demographics
Despite rising fees, and ongoing financial pressures on families, almost 42% of schools reported strong or increasing enrolments. Year 7 continues to be the main entry point which is clearly supported by the data taking up 20.1% of fee estimates, while Kindergarten represents the second most popular requested year group.
The data also indicates a strong demand based on the healthy number of enrolment enquiries flowing into private schools. Feesable continues to be the leading source of high quality leads for schools, offering on average, 19 enrolment enquiries per month – those families who request to be contacted about enrolment. This is just a portion of the number of families that use the School Fee Calculator with an average usage of 78 times per month, per school.
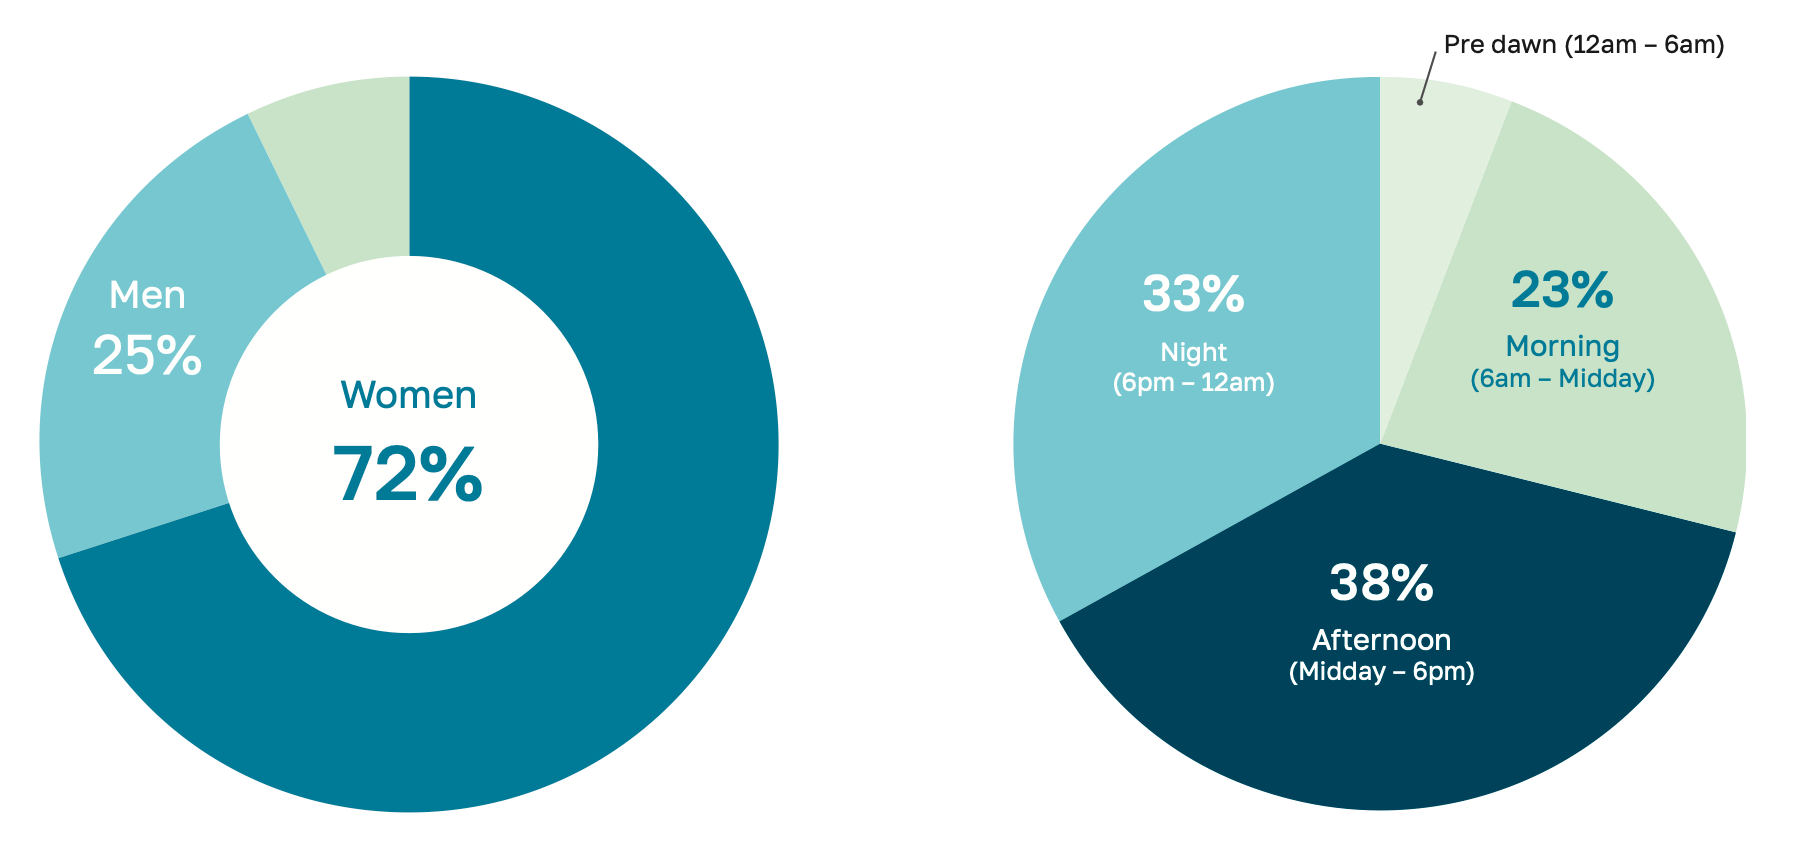
From a demographic perspective, the data reveals that women are doing the majority of school fee research. They do this mid week, in the afternoon or early evening. This data can be useful for planning marketing campaigns and target personas for school messaging.